
Fund Summary
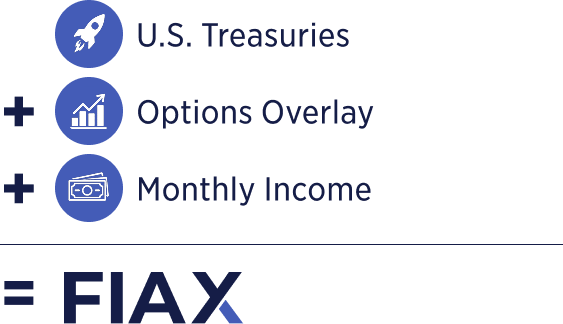
FIAX is an actively managed ETF that is distinct in the fixed-income space. Through the use of options, the fund can replicate a diversified portfolio of income producing ETFs while seeking to mitigate risk with a core holding in United States treasuries. With this distinct structure, FIAX may have lower correlation to traditional equity and fixed-income asset classes.


Fund Objective

FIAX is an actively managed exchange-traded fund (ETF) that under normal circumstances will invest at least 80% of its net assets in U.S. Treasury fixed income securities. The Fund’s defined risk option premium strategy uses options on ETFs across multiple asset classes including equities, commodities and fixed income. FIAX may also create directional index exposure on the S&P 500, Nasdaq 100 or Russell 2000 to participate in upside movement of the underlying index.
The Nicholas Fixed Income Alternative ETF (the “Fund”) seeks current income.

Fund Details
Name | Value |
---|---|
Fund Inception | 11/29/2022 |
Ticker | FIAX |
Primary Exchange | NYSE |
CUSIP | 88634T535 |
Expense Ratio | 0.95% |
Distribution Yield | 8.00% |
Average Duration** | 1.64 Years |
Yield to Maturity** | 4.84% |
30 Day SEC Yield As of 05/31/2025 |
3.29% |
*The 30-Day SEC Yield is calculated with a standardized formula mandated by the SEC. The formula is based on the maximum offering price per share and does not reflect waivers in effect.
**As of 01/31/24
The most recent distribution on 04/17/2025 contains 58.38% return of capital and 41.62% income.
Fund Data & Price
Name | value |
---|---|
Net Assets | $157.84m |
NAV | $18.09 |
Shares Outstanding | 8,725,000 |
Premium/discount Percentage | -0.17% |
Closing Price | $18.06 |
Median 30 Day Spread** | 0.11% |
Rate Date |
---|
06/18/2025 |
*30-Day Median Spread is a calculation of Fund’s median bid-ask spread, expressed as a percentage rounded to the nearest hundredth, computed by: identifying the Fund’s national best bid and national best offer as of the end of each 10 second interval during each trading day of the last 30 calendar days; dividing the difference between each such bid and offer by the midpoint of the national best bid and national best offer; and identifying the median of those values.
Performance
Name |
---|
05/31/2025 |
Fund Name | Fund Ticker | 1 Month | 3 Month | 6 Month | YTD | 1 Year | 3 Year | 5 Year | Since Inception Cumulative | Since Inception Annualized | Date |
---|---|---|---|---|---|---|---|---|---|---|---|
Nicholas Fixed Income Alternative ETF | FIAX NAV | 1.29 | -1.92 | -2.85 | -0.87 | 2.61 | – | – | 6.37 | 2.50 | 05/31/2025 |
Nicholas Fixed Income Alternative ETF | FIAX MKT | 0.87 | -2.49 | -3.34 | -1.98 | 2.11 | – | – | 5.90 | 2.32 | 05/31/2025 |
Bloomberg US Aggregate Bond Index | LBUSTRUU | -0.72 | -0.29 | 0.77 | 2.45 | 5.46 | – | – | 9.63 | 3.74 | 05/31/2025 |
S&P 500 TR | SPTR2 | 6.29 | -0.37 | -1.35 | 1.06 | 13.52 | – | – | 55.06 | 19.17 | 05/31/2025 |
Name |
---|
3/31/2025 |
Fund Name | Fund Ticker | 1 Month | 3 Month | 6 Month | YTD | 1 Year | 3 Year | 5 Year | Since Inception Cumulative | Since Inception Annualized | Date |
---|---|---|---|---|---|---|---|---|---|---|---|
Nicholas Fixed Income Alternative ETF | FIAX NAV | -1.44 | -0.39 | -1.17 | -0.39 | 3.25 | – | – | 6.89 | 2.90 | 03/31/2025 |
Nicholas Fixed Income Alternative ETF | FIAX MKT | -1.55 | -1.04 | -1.20 | -1.04 | 3.34 | – | – | 6.92 | 2.91 | 03/31/2025 |
Bloomberg US Aggregate Bond Index | LBUSTRUU | 0.04 | 2.78 | -0.37 | 2.78 | 4.88 | – | – | 9.99 | 4.16 | 03/31/2025 |
S&P 500 TR | SPTR2 | -5.63 | -4.27 | -1.97 | -4.27 | 8.25 | – | – | 46.88 | 17.90 | 03/31/2025 |
The performance data quoted above represents past performance. Past performance does not guarantee future results. The investment return and principal value of an investment will fluctuate so that an investor’s shares, when sold or redeemed, may be worth more or less than their original cost and current performance may be lower or higher than the performance quoted above. Performance current to the most recent month-end can be obtained by calling (855) 563-6900.
Short term performance, in particular, is not a good indication of the fund’s future performance, and an investment should not be made based solely on historical returns. Returns beyond 1 year are annualized.
A fund’s NAV is the sum of all its assets less any liabilities, divided by the number of shares outstanding. The market price is the most recent price at which the fund was traded.
Distribution Detail
EX Date | Record Date | Payable Date | Fund Total |
---|---|---|---|
06/18/2025 | 06/18/2025 | 06/20/2025 | 0.1221 |
05/15/2025 | 05/15/2025 | 05/16/2025 | 0.1218 |
04/16/2025 | 04/16/2025 | 04/17/2025 | 0.1204 |
03/20/2025 | 03/20/2025 | 03/21/2025 | 0.1236 |
02/20/2025 | 02/20/2025 | 02/21/2025 | 0.1280 |
09/17/2024 | 09/17/2024 | 09/18/2024 | 0.1321 |
04/17/2023 | 04/18/2023 | 04/19/2023 | 0.0475 |
06/14/2023 | 06/15/2023 | 06/16/2023 | 0.0692 |
01/16/2025 | 01/16/2025 | 01/17/2025 | 0.1262 |
11/18/2024 | 11/18/2024 | 11/19/2024 | 0.1302 |
11/15/2023 | 11/16/2023 | 11/17/2023 | 0.1077 |
04/16/2024 | 04/17/2024 | 04/18/2024 | 0.1139 |
07/16/2024 | 07/16/2024 | 07/17/2024 | 0.1153 |
10/16/2023 | 10/17/2023 | 10/18/2023 | 0.1062 |
10/16/2024 | 10/16/2024 | 10/17/2024 | 0.1318 |
09/14/2023 | 09/15/2023 | 09/18/2023 | 0.1076 |
12/17/2024 | 12/17/2024 | 12/18/2024 | 0.2266 |
07/17/2023 | 07/18/2023 | 07/19/2023 | 0.0910 |
12/15/2023 | 12/18/2023 | 12/19/2023 | 0.1157 |
01/17/2023 | 01/18/2023 | 01/19/2023 | 0.0190 |
08/16/2024 | 08/16/2024 | 08/19/2024 | 0.1153 |
02/16/2024 | 02/20/2024 | 02/21/2024 | 0.1160 |
01/17/2024 | 01/18/2024 | 01/19/2024 | 0.1181 |
03/15/2023 | 03/16/2023 | 03/17/2023 | 0.0464 |
08/15/2023 | 08/16/2023 | 08/17/2023 | 0.1104 |
05/15/2023 | 05/16/2023 | 05/17/2023 | 0.0693 |
02/15/2023 | 02/16/2023 | 02/17/2023 | 0.0565 |
06/18/2024 | 06/18/2024 | 06/20/2024 | 0.1141 |
03/18/2024 | 03/19/2024 | 03/20/2024 | 0.1155 |
05/16/2024 | 05/17/2024 | 05/20/2024 | 0.1144 |
Future Distribution Detail
Declaration Date | Ex/Record Date | Payable Date |
---|---|---|
06/17/2025 | 06/18/2025 | 06/20/2025 |
07/16/2025 | 07/17/2025 | 07/18/2025 |
08/13/2025 | 08/14/2025 | 08/15/2025 |
09/17/2025 | 09/18/2025 | 09/19/2025 |
10/15/2025 | 10/16/2025 | 10/17/2025 |
11/19/2025 | 11/20/2025 | 11/21/2025 |
12/17/2025 | 12/18/2025 | 12/19/2025 |
The Fund intends to pay out dividends and interest income, if any, monthly, and distribute any net realized capital gains to its shareholders at least annually. There is no assurance that the Fund will make a distribution in any given month. If the Fund makes distributions, the amounts of such distributions will likely vary greatly from one distribution to the next. Additionally, past monthly distributions have included a return of investor capital, which would decrease the Fund’s NAV and trading price over time. As a result, an investor may suffer significant losses to their investment. The Fund is a newly organized investment company, and it is not possible to estimate how much of any future distribution is a return of capital. Please see fund prospectus for additional information on the tax treatment of distributions.

Top 10 Holdings
Name |
---|
06/23/2025 |
Date | Account | StockTicker | Name | CUSIP | Shares | Price | MarketValue | Weightings | NetAssets | SharesOutstanding | CreationUnits | MoneyMarketFlag |
---|---|---|---|---|---|---|---|---|---|---|---|---|
06/23/2025 | FIAX | 91282CEY3 | United States Treasury Note/Bond 3% 07/15/2025 | 91282CEY3 | 42,925,000.00 | 99.92 | 42,890,251.35 | 27.11% | 158,195,625.00 | 8,750,000 | 350 | |
06/23/2025 | FIAX | 91282CGE5 | United States Treasury Note/Bond 3.875% 01/15/2026 | 91282CGE5 | 52,000,000.00 | 99.84 | 51,916,320.04 | 32.82% | 158,195,625.00 | 8,750,000 | 350 | |
06/23/2025 | FIAX | 91282CJC6 | United States Treasury Note/Bond 4.625% 10/15/2026 | 91282CJC6 | 55,512,000.00 | 100.75 | 55,926,171.70 | 35.35% | 158,195,625.00 | 8,750,000 | 350 | |
06/23/2025 | FIAX | FGXXX | First American Government Obligations Fund 12/01/2031 | 31846V336 | 163,088.55 | 100.00 | 163,088.55 | 0.10% | 158,195,625.00 | 8,750,000 | 350 | Y |
06/23/2025 | FIAX | SLV 250718C00031000 | SLV US 07/18/25 C31 | SLV 250718C00031000 | -3,700.00 | 2.03 | -749,250.00 | -0.47% | 158,195,625.00 | 8,750,000 | 350 | |
06/23/2025 | FIAX | SLV 250718C00035000 | SLV US 07/18/25 C35 | SLV 250718C00035000 | 3,700.00 | 0.28 | 101,750.00 | 0.06% | 158,195,625.00 | 8,750,000 | 350 | |
06/23/2025 | FIAX | SPY 250630C00520000 | SPY US 06/30/25 C520 | SPY 250630C00520000 | 100.00 | 74.96 | 749,550.00 | 0.47% | 158,195,625.00 | 8,750,000 | 350 | |
06/23/2025 | FIAX | SPY 250630C00610000 | SPY US 06/30/25 C610 | SPY 250630C00610000 | -100.00 | 0.54 | -5,400.00 | 0.00% | 158,195,625.00 | 8,750,000 | 350 | |
06/23/2025 | FIAX | SVXY 250718P00038000 | SVXY US 07/18/25 P38 | SVXY 250718P00038000 | -2,500.00 | 1.15 | -287,500.00 | -0.18% | 158,195,625.00 | 8,750,000 | 350 | |
06/23/2025 | FIAX | SVXY 250718P00043000 | SVXY US 07/18/25 P43 | SVXY 250718P00043000 | 2,500.00 | 3.38 | 843,750.00 | 0.53% | 158,195,625.00 | 8,750,000 | 350 | |
06/23/2025 | FIAX | TLT 250630C00082000 | TLT US 06/30/25 C82 | TLT 250630C00082000 | 1,100.00 | 4.50 | 495,000.00 | 0.31% | 158,195,625.00 | 8,750,000 | 350 | |
06/23/2025 | FIAX | TLT 250630C00089000 | TLT US 06/30/25 C89 | TLT 250630C00089000 | -1,100.00 | 0.10 | -10,450.00 | -0.01% | 158,195,625.00 | 8,750,000 | 350 | |
06/23/2025 | FIAX | USO 250718P00076000 | USO US 07/18/25 P76 | USO 250718P00076000 | -1,950.00 | 2.14 | -417,300.00 | -0.26% | 158,195,625.00 | 8,750,000 | 350 | |
06/23/2025 | FIAX | USO 250718P00077000 | USO US 07/18/25 P77 | USO 250718P00077000 | -2,500.00 | 2.53 | -632,500.00 | -0.40% | 158,195,625.00 | 8,750,000 | 350 | |
06/23/2025 | FIAX | USO 250718P00083000 | USO US 07/18/25 P83 | USO 250718P00083000 | 4,450.00 | 5.33 | 2,369,625.00 | 1.50% | 158,195,625.00 | 8,750,000 | 350 | |
06/23/2025 | FIAX | XBI 250718C00077000 | XBI US 07/18/25 C77 | XBI 250718C00077000 | 1,700.00 | 6.48 | 1,100,750.00 | 0.70% | 158,195,625.00 | 8,750,000 | 350 | |
06/23/2025 | FIAX | XBI 250718C00084000 | XBI US 07/18/25 C84 | XBI 250718C00084000 | -1,700.00 | 2.03 | -345,100.00 | -0.22% | 158,195,625.00 | 8,750,000 | 350 | |
06/23/2025 | FIAX | XLP 250718C00078000 | XLP US 07/18/25 C78 | XLP 250718C00078000 | 4,700.00 | 3.23 | 1,518,100.00 | 0.96% | 158,195,625.00 | 8,750,000 | 350 | |
06/23/2025 | FIAX | XLP 250718C00084000 | XLP US 07/18/25 C84 | XLP 250718C00084000 | -4,700.00 | 0.21 | -96,350.00 | -0.06% | 158,195,625.00 | 8,750,000 | 350 | |
06/23/2025 | FIAX | Cash&Other | Cash & Other | Cash&Other | 2,678,341.96 | 1.00 | 2,678,341.96 | 1.69% | 158,195,625.00 | 8,750,000 | 350 | Y |
The Nicholas Fixed Income Alternative ETF (FIAX) Fund is an actively managed exchange-traded fund (“ETF”) that seeks to provide income using U.S. Treasury fixed income securities and a “defined risk option premium.”
The Fund’s defined risk option premium strategy uses options on ETFs across multiple asset classes (e.g., equities, commodities, fixed income). Through the defined risk option premium strategy, two options transactions are paired together in order to create a “defined risk” trade that caps the maximum possible gains and losses from the outset.
Holdings are subject to change without notice.

Holdings are subject to change without notice.
Under normal circumstances, the Fund will invest at least 80% of its net assets in U.S. Treasury fixed income securities.
U.S. Treasuries are debt obligations issued and backed by the full faith and credit of the United States government. That backing carries weight due to the federal government’s taxing power and the relative size and strength of the U.S. economy. U.S. Treasury securities can provide dependable, steady cash flow and preserve invested principal, if held to maturity.

Purchase
The Fund (FIAX) is available through various channels including via phone (855) 563-6900, broker-dealers, investment advisers, and other financial services firms, including:
This Fund is not affiliated with these financial service firms. Their listing should not be viewed as a recommendation or endorsement.